Overview Dashboard
The Overview dashboard provides a top level view of how Influence, Team & Site are performing. Metrics are broken into Engagement on Social, Engagement on Site, and Sales on Site.
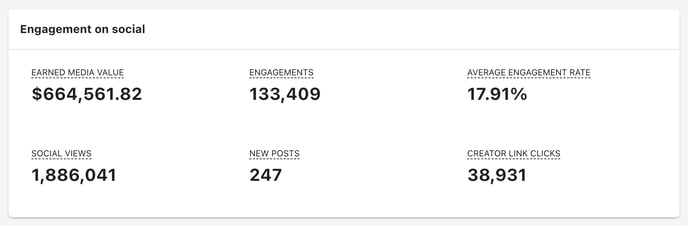
Engagement on Social
This section allows you to quantify all posts and their performance on social media. Data for social posts is aggregated for every campaign and/or team program. These insights give you a top level view of how posts are performing and their value.
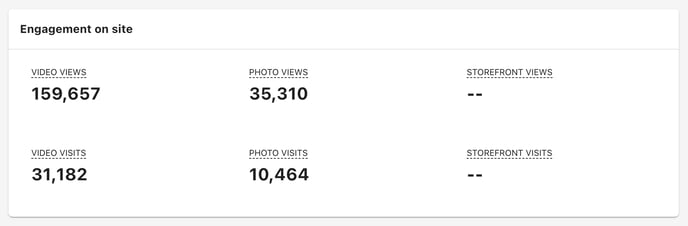
Engagement on site
This section gives you data around how creator content performs when used on your site. Metrics are broken out by content type so that you can quickly and easily see which content is moving the needle on your site.
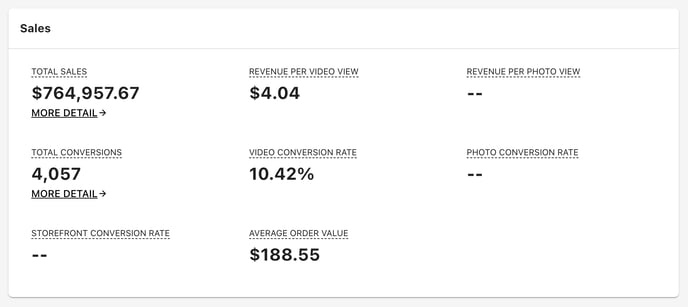
Sales
The Sales section displays conversion data coming from your website that is attributable to content, creators, and/or campaigns that have generated activity on your site. Sales metrics are broken out by content and engagement type so you can quickly and easily determine who and what drives sales on your site.
Attribution
Sales are attributed to any of the following event sources:
(1) Video - An on-site video view, product click on a video or a visit to a creator storefront where a video is the first asset to be consumed.
(2) Photo - An on-site photo view, product click on a photo or a visit to a creator storefront where a photo is the first asset to be consumed.
(3) Product Link - A click on a product link uniquely generated for each creator.
(4) Storefront - A click on a link to a creator's storefront page.
Depending upon the event that occurs, one of the following types of sales will be reported:
Video Sale
A "Video Sale" is an order placed by a customer who, in the 30 days prior to the order, generated a video event (defined above), where such event was the last event prior to placing the order.
Photo Sale
A Photo Sale is an order placed by a customer who, in the 30 days prior to the order, generated a photo event (defined above), where such event was the last event prior to placing the order.
Product Link Sale
A Product Link sale is generated when a customer clicks on a product link from a creator, where the click was the last event prior to placing the order.
Storefront Sale
A Storefront sale is generated when a customer views a creator storefront and that view was the last event prior to placing the order.
Reports
The reports section of the analytics dashboard is where you can find many powerful purpose-driven reports allowing you to zoom into program performance from any perspective.
Social engagement
The social engagement report gives you granular data around how all social posts from campaigns and/or your Team program have performed during a given date range.

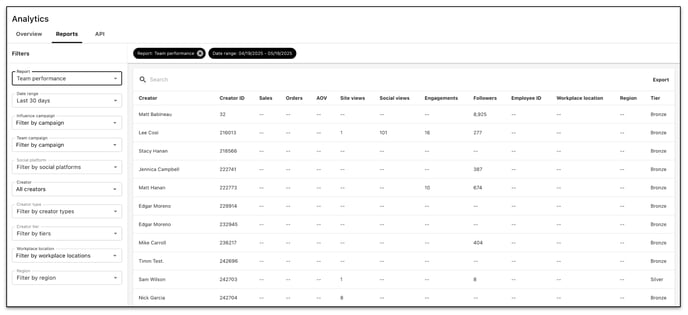
Team performance
The team performance report breaks your program data down by individual creators so that you can see performance on a per creator basis.
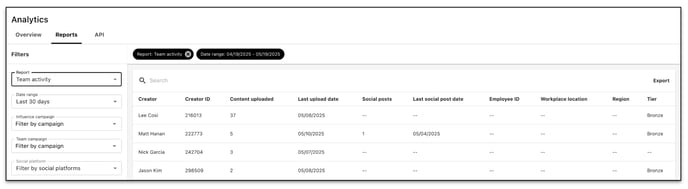
Team activity
The team activity report allows you to monitor the specific activities of your Team creators.
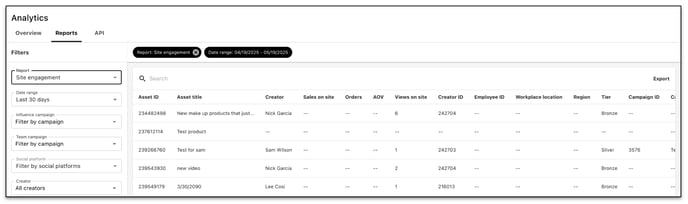
Site engagement
The site engagement report allows you to see how each individual asset (video or photo) has performed on your site.
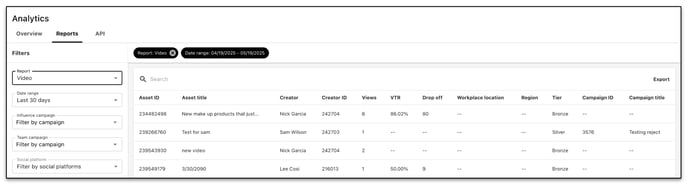
Video
The video report gives you granular data around the viewership for each video in your program.
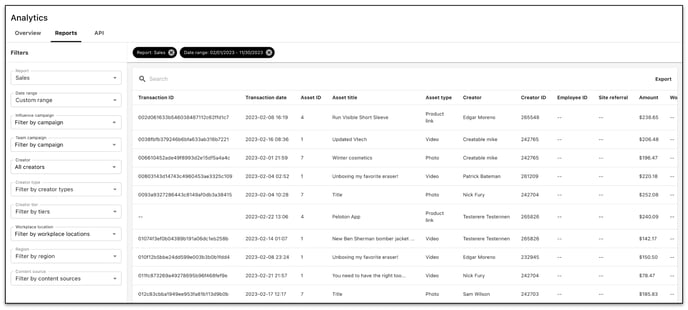
Sales
The sales report gives you a top level breakdown of every transaction that has been attributed to your program.
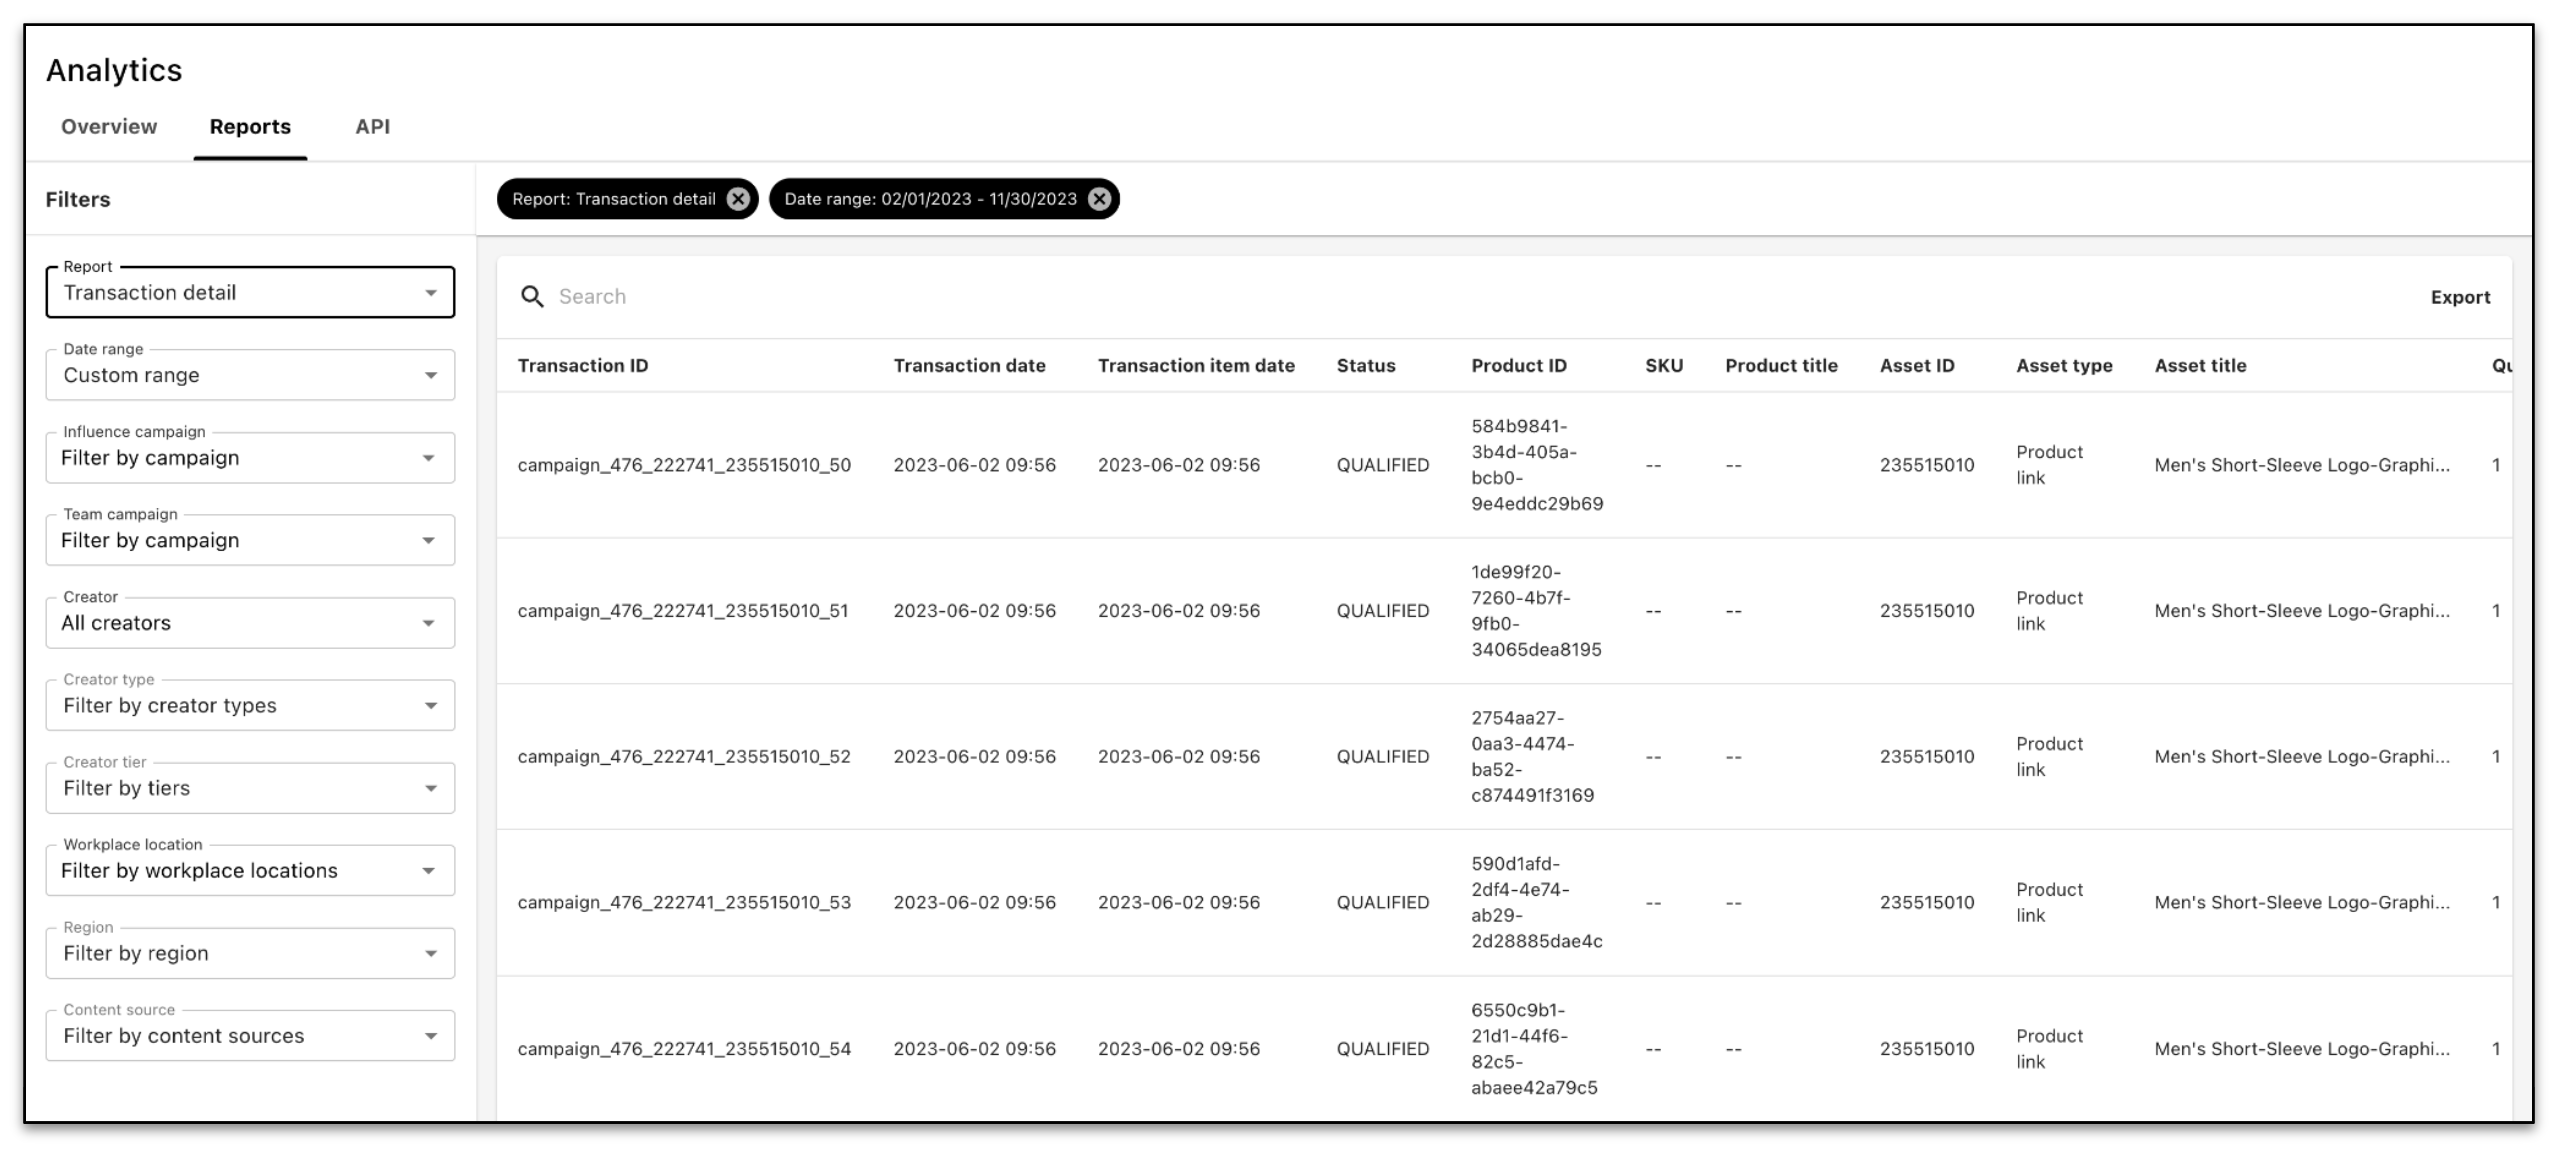
Transaction detail
The transaction detail report gives you an item-by-item breakdown of every product sold in every transaction that has been attributed to your program.